Spring Boot Actuator可以帮助你监控和管理Spring Boot应用,比如健康检查、审计、统计和HTTP追踪等。所有的这些特性可以通过JMX或者HTTP endpoints来获得。
Actuator同时还可以与外部应用监控系统整合,比如 Prometheus, Graphite, DataDog, Influx, Wavefront, New Relic等。这些系统提供了非常好的仪表盘、图标、分析和告警等功能,使得你可以通过统一的接口轻松的监控和管理你的应用。
Actuator使用Micrometer来整合上面提到的外部应用监控系统。这使得只要通过非常小的配置就可以集成任何应用监控系统。
我将把Spring Boot Actuator教程分为两部分:
- 第一部分(本文)教你如何配置Actuator和通过Http endpoints来进入这些特征。
- 第二部分教你如何整合Actuator和外部应用监控系统。
创建一个有Actuator的Spring Boot工程
首先让我们建一个依赖acutator的简单应用。
你可以使用Spring Boot CLI创建应用:
1 | spring init -d=web,actuator -n=actuator actuator |
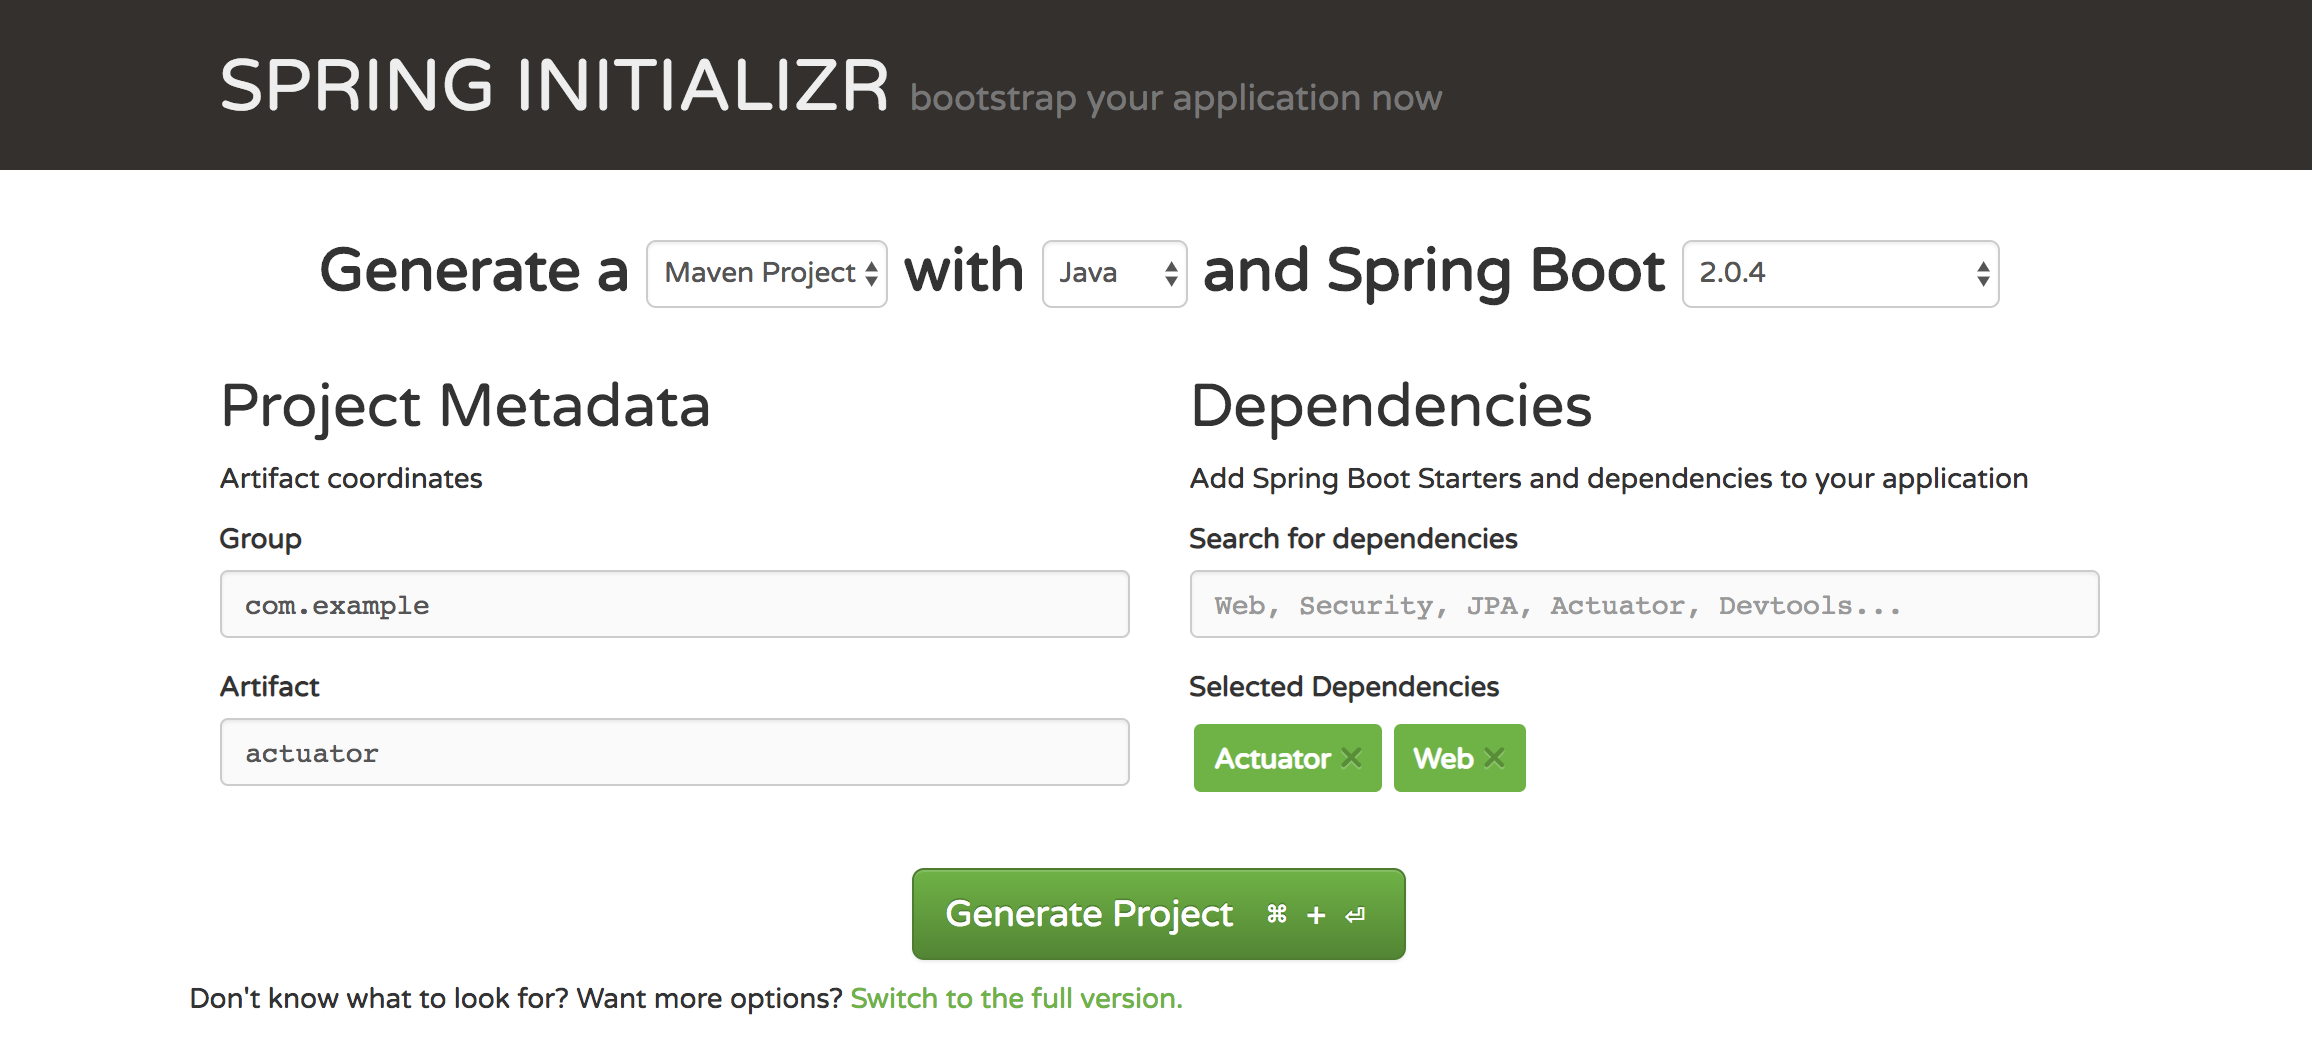
或者,你可以使用Spring Initializr网站来创建应用:
增加Spring Boot Actuator到一个存在的应用
你可以增加spring-boot-actuator模块到一个已经存在的应用,通过使用下面的依赖。
1 | <dependencies> |
对于Gradle,依赖如下:
1 | dependencies { |
使用Actuator Endpoints来监控应用
Actuator创建了所谓的endpoint来暴露HTTP或者JMX来监控和管理应用。
举个例子,有一个叫/health的endpoint,提供了关于应用健康的基础信息。/metricsendpoints展示了几个有用的度量信息,比如JVM内存使用情况、系统CPU使用情况、打开的文件等等。/loggersendpoint展示了应用的日志和可以让你在运行时改变日志等级。
值得注意的是,每一给actuator endpoint可以被显式的打开和关闭。此外,这些endpoints也需要通过HTTP或者JMX暴露出来,使得它们能被远程进入。
让我们运行应用并且尝试进入默认通过HTTP暴露的打开状态的actuator endpoints。之后,我们将学习如何打开更多的endpoints并且通过HTTP暴露它们。
在应用的根目录下打开命令行工具运行以下命令:
1 | mvn spring-boot:run |
应用默认使用8080端口运行。一旦这个应用启动了,你可以通过http://localhost:8080/actuator来展示所有通过HTTP暴露的endpoints。
1 | {"_links":{"self":{"href":"http://localhost:8080/actuator","templated":false},"health":{"href":"http://localhost:8080/actuator/health","templated":false},"info":{"href":"http://localhost:8080/actuator/info","templated":false}}} |
打开http://localhost:8080/actuator/health,则会显示如下内容:
1 | {"status":"UP"} |
状态将是UP只要应用是健康的。如果应用不健康将会显示DOWN,比如与仪表盘的连接异常或者缺水磁盘空间等。下一节我们将学习spring boot如何决定应用的健康和如何修复这些健康问题。
infoendpoint(http://localhost:8080/actuator/info)展示了关于应用的一般信息,这些信息从编译文件比如META-INF/build-info.properties或者Git文件比如git.properties或者任何环境的property中获取。你将在下一节中学习如何改变这个endpoint的输出。
默认,只有health和info通过HTTP暴露了出来。这也是为什么/actuator页面只展示了health和infoendpoints。我们将学习如何暴露其他的endpoint。首先,让我们看看其他的endpoints是什么。
以下是一些非常有用的actuator endpoints列表。你可以在official documentation上面看到完整的列表。
| Endpoint ID | Description |
|---|---|
| auditevents | 显示应用暴露的审计事件 (比如认证进入、订单失败) |
| info | 显示应用的基本信息 |
| health | 显示应用的健康状态 |
| metrics | 显示应用多样的度量信息 |
| loggers | 显示和修改配置的loggers |
| logfile | 返回log file中的内容(如果logging.file或者logging.path被设置) |
| httptrace | 显示HTTP足迹,最近100个HTTP request/repsponse |
| env | 显示当前的环境特性 |
| flyway | 显示数据库迁移路径的详细信息 |
| liquidbase | 显示Liquibase 数据库迁移的纤细信息 |
| shutdown | 让你逐步关闭应用 |
| mappings | 显示所有的@RequestMapping路径 |
| scheduledtasks | 显示应用中的调度任务 |
| threaddump | 执行一个线程dump |
| heapdump | 返回一个GZip压缩的JVM堆dump |
打开和关闭Actuator Endpoints
默认,上述所有的endpints都是打开的,除了shutdown endpoint。
你可以通过设置management.endpoint.<id>.enabled to true or false(id是endpoint的id)来决定打开还是关闭一个actuator endpoint。
举个例子,要想打开shutdown endpoint,增加以下内容在你的application.properties文件中:
1 | management.endpoint.shutdown.enabled=true |
暴露Actuator Endpoints
默认,素偶偶的actuator endpoint通过JMX被暴露,而通过HTTP暴露的只有health和info。
以下是你可以通过应用的properties可以通过HTTP和JMX暴露的actuator endpoint。
通过HTTP暴露Actuator endpoints。
1
2
3# Use "*" to expose all endpoints, or a comma-separated list to expose selected ones
management.endpoints.web.exposure.include=health,info
management.endpoints.web.exposure.exclude=通过JMX暴露Actuator endpoints。
1
2
3
# Use "*" to expose all endpoints, or a comma-separated list to expose selected ones
management.endpoints.jmx.exposure.include=*
management.endpoints.jmx.exposure.exclude=
通过设置management.endpoints.web.exposure.include为*,我们可以在http://localhost:8080/actuator页面看到如下内容。
1 | {"_links":{"self":{"href":"http://localhost:8080/actuator","templated":false},"auditevents":{"href":"http://localhost:8080/actuator/auditevents","templated":false},"beans":{"href":"http://localhost:8080/actuator/beans","templated":false},"health":{"href":"http://localhost:8080/actuator/health","templated":false},"conditions":{"href":"http://localhost:8080/actuator/conditions","templated":false},"configprops":{"href":"http://localhost:8080/actuator/configprops","templated":false},"env":{"href":"http://localhost:8080/actuator/env","templated":false},"env-toMatch":{"href":"http://localhost:8080/actuator/env/{toMatch}","templated":true},"info":{"href":"http://localhost:8080/actuator/info","templated":false},"loggers":{"href":"http://localhost:8080/actuator/loggers","templated":false},"loggers-name":{"href":"http://localhost:8080/actuator/loggers/{name}","templated":true},"heapdump":{"href":"http://localhost:8080/actuator/heapdump","templated":false},"threaddump":{"href":"http://localhost:8080/actuator/threaddump","templated":false},"prometheus":{"href":"http://localhost:8080/actuator/prometheus","templated":false},"metrics-requiredMetricName":{"href":"http://localhost:8080/actuator/metrics/{requiredMetricName}","templated":true},"metrics":{"href":"http://localhost:8080/actuator/metrics","templated":false},"scheduledtasks":{"href":"http://localhost:8080/actuator/scheduledtasks","templated":false},"httptrace":{"href":"http://localhost:8080/actuator/httptrace","templated":false},"mappings":{"href":"http://localhost:8080/actuator/mappings","templated":false}}} |
解析常用的actuator endpoint
/health endpoint
health endpoint通过合并几个健康指数检查应用的健康情况。
Spring Boot Actuator有几个预定义的健康指标比如DataSourceHealthIndicator, DiskSpaceHealthIndicator, MongoHealthIndicator, RedisHealthIndicator, CassandraHealthIndicator等。它使用这些健康指标作为健康检查的一部分。
举个例子,如果你的应用使用Redis,RedisHealthindicator将被当作检查的一部分。如果使用MongoDB,那么MongoHealthIndicator将被当作检查的一部分。
你也可以关闭特定的健康检查指标,比如在prpperties中使用如下命令:
1 | management.health.mongo.enabled=false |
默认,所有的这些健康指标被当作健康检查的一部分。
显示详细的健康信息
health endpoint只展示了简单的UP和DOWN状态。为了获得健康检查中所有指标的详细信息,你可以通过在application.yaml中增加如下内容:
1 | management: |
一旦你打开上述开关,你在/health中可以看到如下详细内容:
1 | {"status":"UP","details":{"diskSpace":{"status":"UP","details":{"total":250790436864,"free":27172782080,"threshold":10485760}}}} |
health endpoint现在包含了DiskSpaceHealthIndicator。
如果你的应用包含database(比如MySQL),health endpoint将显示如下内容:
1 | { |
如果你的MySQL server没有启起来,状态将会变成DOWN:
1 | { |
创建一个自定义的健康指标
你可以通过实现HealthIndicator接口来自定义一个健康指标,或者继承AbstractHealthIndicator类。
1 | package com.example.actuator.health; |
一旦你增加上面的健康指标到你的应用中去后,health endpoint将展示如下细节:
1 | { |
/metrics endpoint
metrics endpoint展示了你可以追踪的所有的度量。
1 | { |
想要获得每个度量的详细信息,你需要传递度量的名称到URL中,像
http://localhost:8080/actuator/metrics/{MetricName}
举个例子,获得systems.cpu.usage的详细信息,使用以下URLhttp://localhost:8080/actuator/metrics/system.cpu.usage。它将显示如下内容:
1 | { |
/loggers endpoint
loggers endpoint,可以通过访问http://localhost:8080/actuator/loggers来进入。它展示了应用中可配置的loggers的列表和相关的日志等级。
你同样能够使用http://localhost:8080/actuator/loggers/{name}来展示特定logger的细节。
举个例子,为了获得root logger的细节,你可以使用http://localhost:8080/actuator/loggers/root:
1 | { |
在运行时改变日志等级
loggers endpoint也允许你在运行时改变应用的日志等级。
举个例子,为了改变root logger的等级为DEBUG ,发送一个POST请求到http://localhost:8080/actuator/loggers/root,加入如下参数
1 | { |
这个功能对于线上问题的排查非常有用。
同时,你可以通过传递null值给configuredLevel来重置日志等级。
/info endpoint
info endpoint展示了应用的基本信息。它通过META-INF/build-info.properties来获得编译信息,通过git.properties来获得Git信息。它同时可以展示任何其他信息,只要这个环境property中含有infokey。
你可以增加properties到application.yaml中,比如:
1 | # INFO ENDPOINT CONFIGURATION |
注意,我使用了Spring Boot的Automatic property expansion 特征来扩展来自maven工程的properties。
一旦你增加上面的properties,info endpoint将展示如下信息:
1 | { |
使用Spring Security来保证Actuator Endpoints安全
Actuator endpoints是敏感的,必须保障进入是被授权的。如果Spring Security是包含在你的应用中,那么endpoint是通过HTTP认证被保护起来的。
如果没有, 你可以增加以下以来到你的应用中去:
1 | <dependency> |
接下去让我们看一下如何覆写spring security配置,并且定义你自己的进入规则。
下面的例子展示了一个简单的spring securiy配置。它使用叫做EndPointRequest
的ReqeustMatcher工厂模式来配置Actuator endpoints进入规则。
1 | package com.example.actuator.config; |
为了能够测试以上的配置,你可以在application.yaml中增加spring security用户。
1 | # Spring Security Default user name and password |
你可以在Github上看到完整的代码。
下一部分:Spring Boot Metrics监控之Prometheus&Grafana
更多学习资源
- Spring Boot Actuator: Production-ready features
- Micrometer: Spring Boot 2’s new application metrics collector